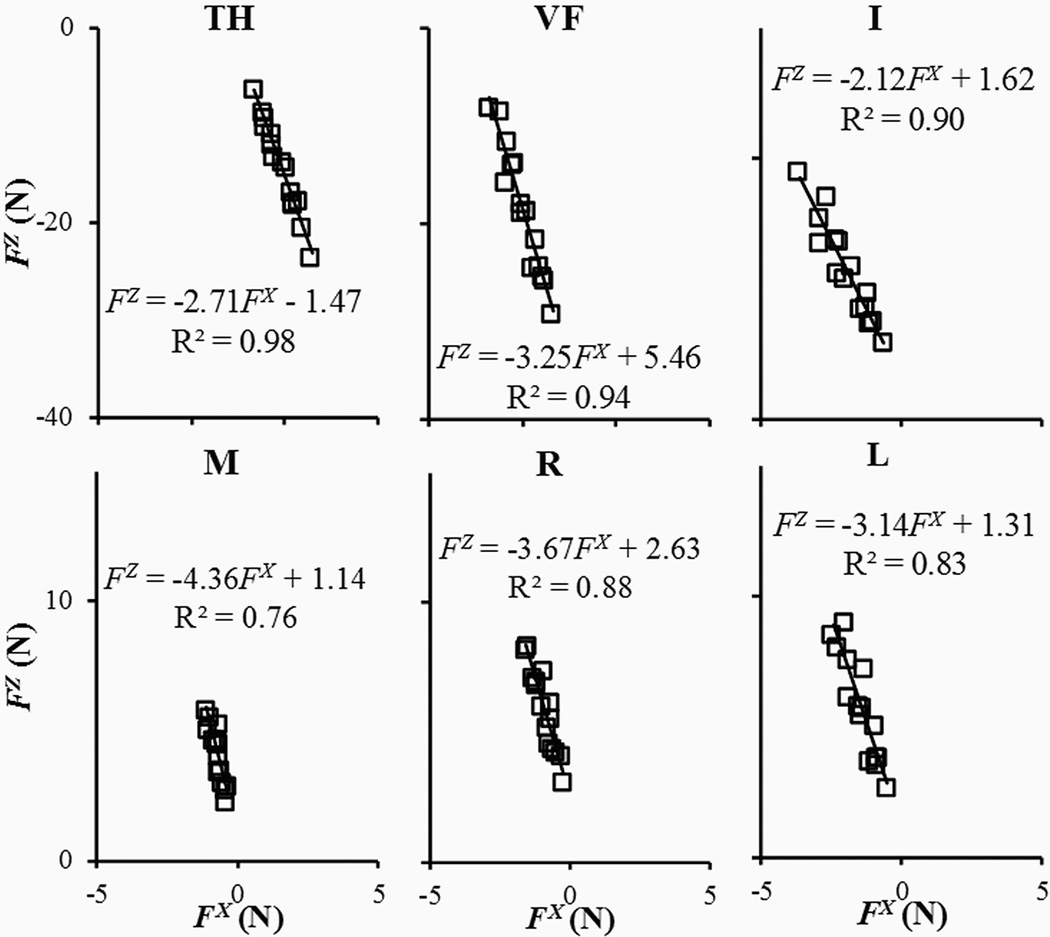
Figure 3.

The dependences between the normal and tangential force components for a typical subject. Linear regression equations and coefficients of determination are shown on each graph. Each data point is the mean across trials in one of the fifteen condition × phase combinations.
