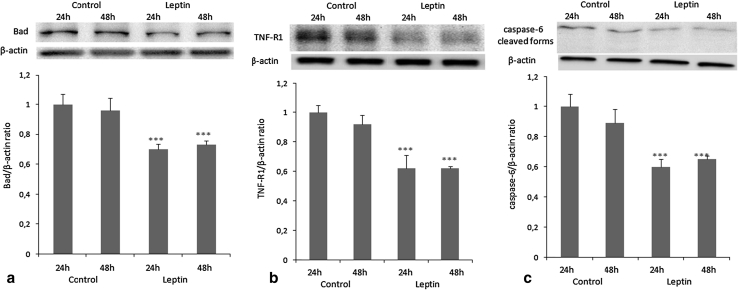
Fig. 5.
Effects of leptin (40 ng/ml) on a Bad (23 kDa), b TNFR1 (55 kDa), and c caspase 6 (35, 15 kDa) protein expression in OVCAR-3 cells. Cells were treated with leptin for 24 and 48 h. β-actin (42 kDa) served as the loading control, and densitometry of TNFR1, Bad, and caspase 6 bands were normalized to β-actin. Signal intensities are expressed in arbitrary units. Values are mean ± SEM. ***Significantly different from control at P < 0.001

