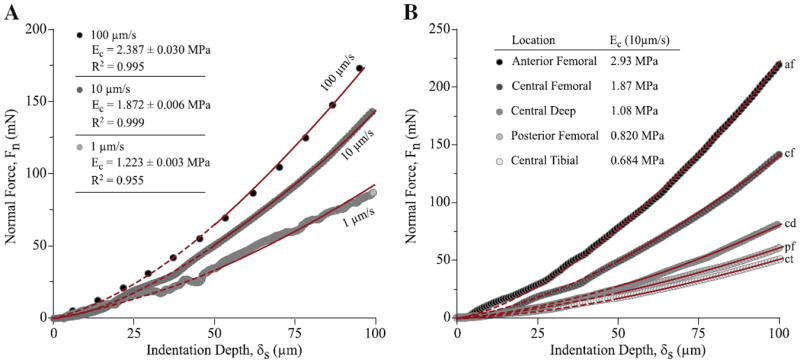
Fig. 4.

Representative indentation results and illustration of analysis methods. (A) The normal force is plotted versus indentation depth for a central femoral aspect sample at the indentation rates of 1, 10, and 100 μm/s. The line represents the best fit to Hertz model for each measurement. The effective modulus for the fit is given with the corresponding uncertainty and coefficient of determination (R2). The data shown for 1 μm/s was the worst fit in the study. (B) The normal force is plotted versus indentation depth for the five locations at one meniscus under a commanded indentation rate of 10 μm/s. Only data from 50 to 100 μm depth (indicated by thin solid lines) were used in the fitting and analysis.
