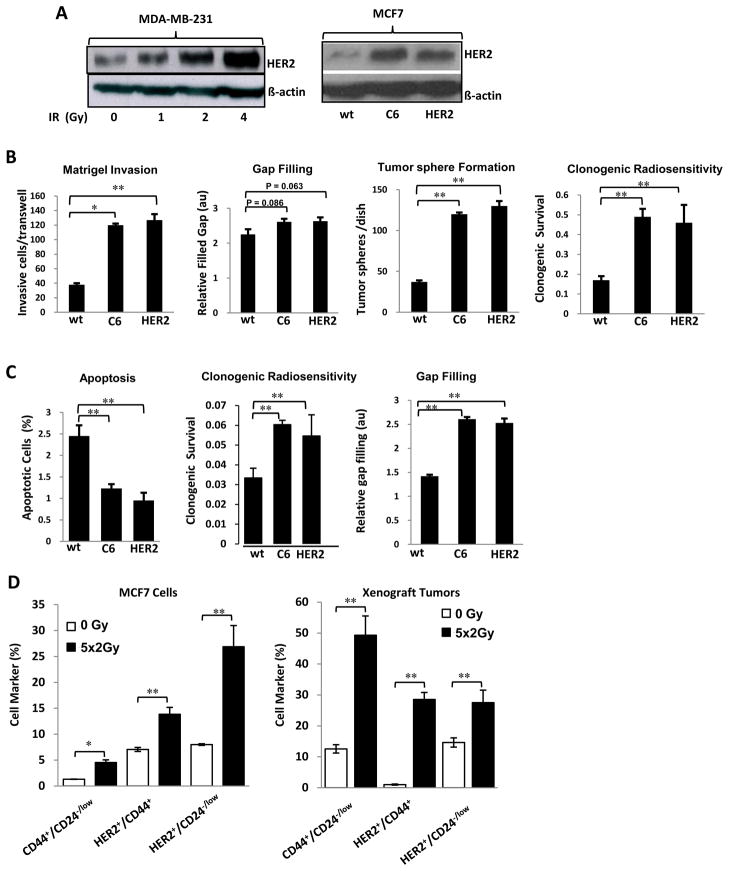
Figure 1.
HER2 protein expression causes the aggressive growth in breast cancer cells with HER2−/low status. (A) HER2 protein expression was dose-dependently induced by IR in MDA-MB- 231 cells and in a radioresistant MCF7/C6 (C6) cells (8, 20). MDA-MB-231 were exposed to increased doses of irradiation (0–4 Gy). Twenty-four hours post-irradiation, cells were collected and tested for the expression of HER2. For MCF7/C6 cells, parental MCF7 cells (wt) and MCF7 cells stably transfected with HER2 gene (HER2) were used as negative and positive controls, respectively. (B) Evaluation of cell aggressiveness. Matrigel invasion assay: Cells were cultured in Matrigel and cells migrating through the transwell were counted to reflect cell’s aggressiveness (mean+SE; n=6; *p<0.05, **p<0.01; Depicted images of invaded cells are illustrated in Fig. S1C). The gap-filling capacity was calculated as the ratio of filled gaps at 96 h post scraping compared to the filled gap at 0 h (Additional data are shown in Fig. S1A). The tumor sphere formation was evaluated as the number of tumor spheres formed per dish (mean+SE; n = 6; **p<0.01; Images of tumor sphere formation are illustrated in Fig. S1D). Clonogenic survival was evaluated as the percentage of cells seeded that were able to form colonies 14 days after irradiation (mean+SE; n = 3; **p<0.01). (C) The radioresistant phenotype of MCF7/C6 (C6) cells was compared with MCF7/HER2 (HER2) and the parental MCF7 cells after treatment with 5 Gy IR by measuring apoptosis, clonogenic survival, and gap filling rates (mean+SE; n=3; **p<0.01). (D) Quantification of BCSCs with the feature of HER2+/CD44+/CD24−/low in the surviving fraction of MCF7 cells (left) or xenograft tumors (right) treated with 5 × 2 Gy IR. Cell suspensions from control (sham) or irradiated cells or tumors were sorted by FACS with conjugated antibodies (APC for HER2, PE for CD44, and FITC for CD24; n = 3 from separate sorting, *p<0.05, **p<0.01; additional FACS data are shown in Fig. S3 and Table S1).

