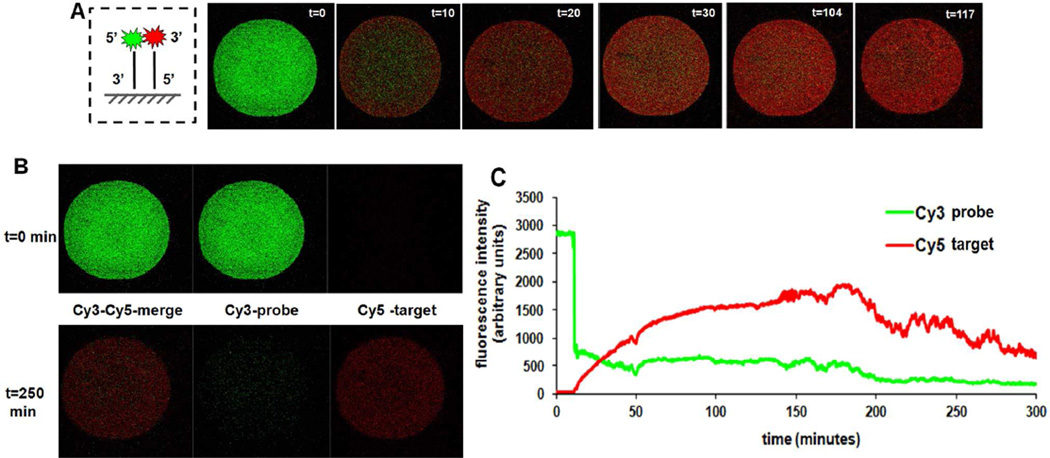
Figure 2.
Real-time hybridization of single DNA spot with dyes on same end of the probe-target duplex. A) Schematic representation of the duplex: 5’-Cy3-Oligo1-probe: Oligo2–3’-Cy5-target with; images of DNA spot with merged Cy3 and Cy5 emission intensity at various time points. B) Images of spots in Cy3 or Cy5 or both filter channels during real-time imaging of single array spots before (t=0) and after (t=250 min) hybridization. C) Real-time hybridization of Cy3/Cy5 fluorescence intensity changes in single spots versus time. Duplex formation kinetics under this unstirred transport-limited regime follows pseudo-first order kinetics (see supplementary information and Figure S-7).
Note: microscopy image contrast has been digitally enhanced for the figures to better facilitate direct observation of the optical changes observed over time in situ.

