
Figure 4.
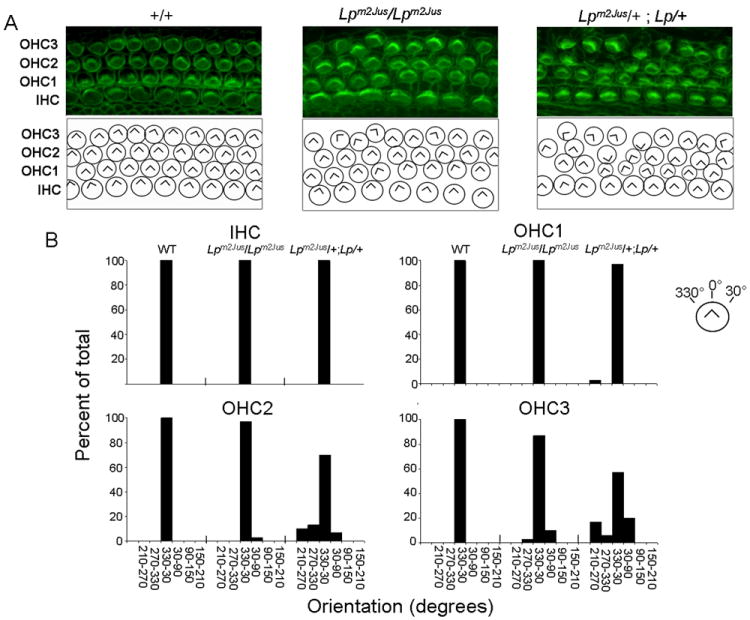
Comparison of hair bundle orientation defects at the apical region of the organ of Corti in WT, Lpm2Jus/ Lpm2Jus and Lpm2Jus/+; Lp/+ at E18.5. Panel A, Top, Stereocilia labeled with phalloidin (green). Bottom, Diagrams showing the scoring of hair bundle orientation for the images above. IHC, Inner hair cells; OHC1, Inner row of outer hair cells; OHC2, central row of outer hair cells; OHC3, outer row of outer hair cells. The genotype is indicated above each column of panels. Panel B. Quantification of the IHC, OHC1, OHC2, and OHC3 bundle orientations for each of the three genotypes indicated above based on phalloidin staining. The convention for angular measurements is shown in the top right corner of the panel. Statistical analysis was done by the Kolmogorov - Smirnov test (P=0.005 for OHC2 and OHC3 of the Lpm2Jus/+; Lp/+ as compared to the wild-type).