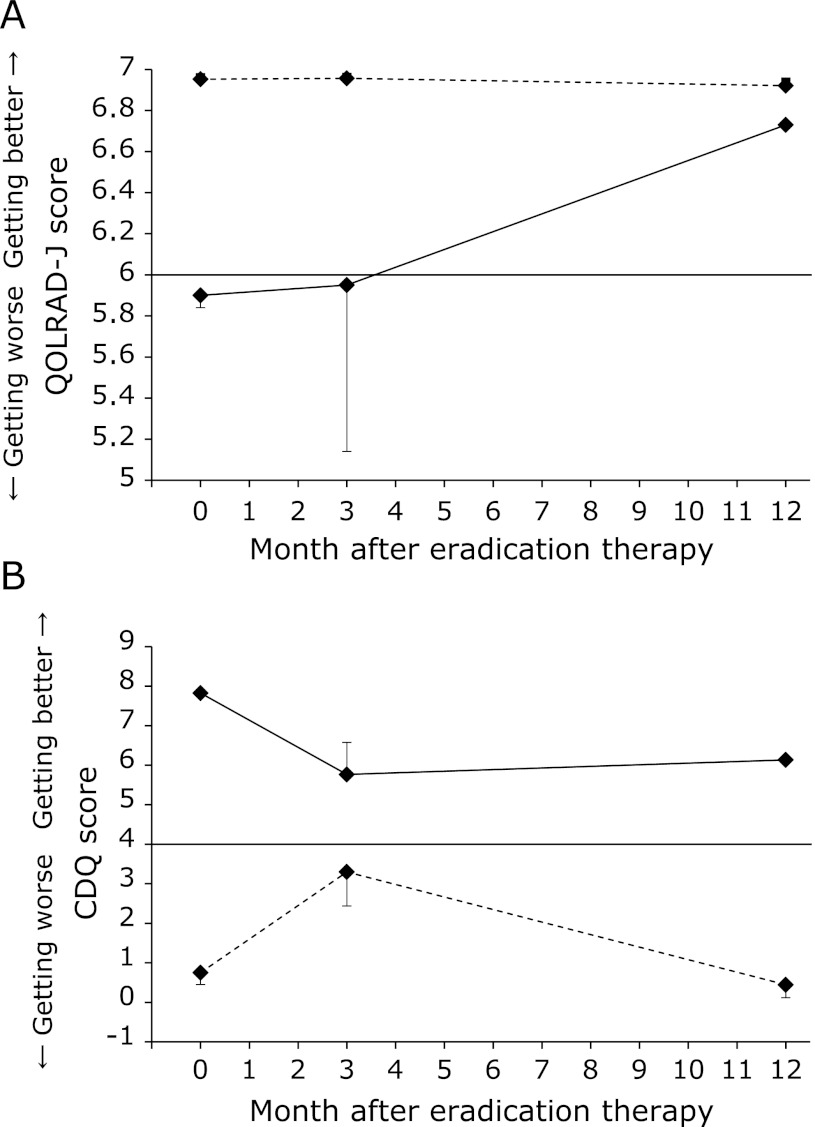
Fig. 3.
Changes in QOLRAD-J and CDQ scores with low or high initial scores. The solid lines represent the low-score group and the dashed lines the high-score group. Changes in the QOLRAD-J score according to the initial score dichotomized at a cut-off of 6 [≥6 (n = 33); <6 (n = 7)] (A). Changes in the CDQ score according to initial score dichotomized at a cut-off of 4 [≥4 (n = 17); <4 (n = 20)] (B). *p<0.05 compared to BE using one-way repeated-measures analysis of variance and the Bonferroni post-hoc test.

