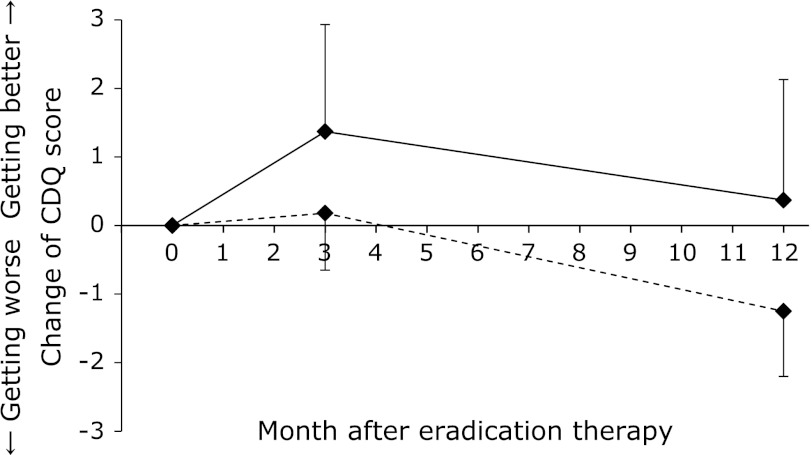
Fig. 5.
Changes in CDQ scores with initial PG positive/negative test group. The solid lines represent the PG positive test group (n = 8) and the dashed lines the PG negative test group (n = 23). CDQ score tended to improve in the PG-negative test group than in the PG-positive test group (p = 0.065).

