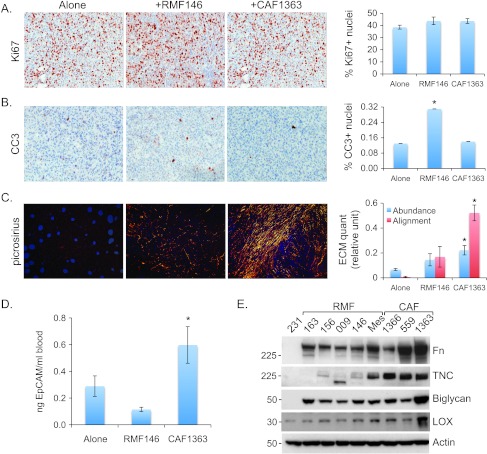
Figure 7.
CAFs deposit aligned matrix and promote dissemination of malignant cells in vivo. Representative 20x images of tumors stained with (A) Ki67, (B) CC3, or (C) picrosirius, grown in the absence (alone) or presence of RMF146 or CAF1363, as indicated. Staining was quantified using three to four randomly chosen fields from each tumor section. Alone (n = 34, 15, 10), RMF146 (n = 12, 8, 8), and CAF1363 (n = 22, 12, 7) for stains shown in A, B, and C, respectively. Quantification of stains is shown in bar graphs as average ± SEM for each group. P values correspond to Student's t test comparing scores of tumors grown in the presence or absence of fibroblasts. For Ki67: alone versus RMF146 (P = .11), alone versus CAF1363 (P = .72); for CC3: alone versus RMF146 (P <.001), alone versus CAF1363 (P = .8); for ECM abundance: alone versus RMF146 (P = .09), alone versus CAF1363 (P < .001); for ECM alignment: alone versus RMF146 (P = .04), alone versus CAF1363 (P < .001). (D) qPCR analysis of EpCAM levels in genomic DNA extracted from blood collected 8 weeks following injection of 5 x 10⁵ 231-Lux cells alone (n = 9) or in combination with 1.5 x 10⁶ RMF146 (n = 4), or 1.5 x 10⁶ CAF1363 (n = 7). Student's t test comparing qPCR replicates from alone versus RMF146 (P = .15), alone versus CAF1363 (P = .04), and RMF146 versus CAF1363 (P = .01). (E) Representative immunoblots of Fn, TNC, biglycan, and LOX expression in MDA-MB-231 cells (231), RMFs (163, 156, 009, 146, Mes), and CAFs (1366, 559, 1363). “Mes” denotes an RMF that induced the aligned mesenchymal phenotype. Statistically significant differences between endpoints measured in tumors grown alone versus with fibroblasts are denoted with asterisk.

