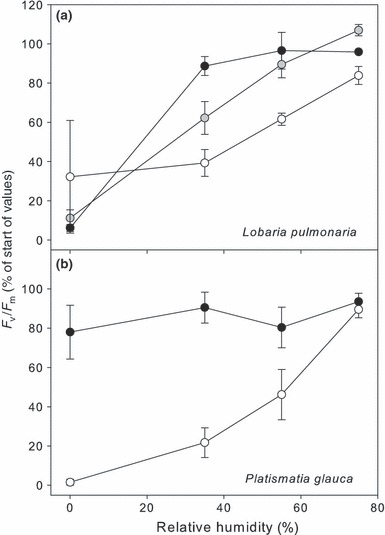
Fig. 2.

Level of photoinhibition after combined drying (0%, 35%, 55% and 75% relative humidity) and light exposure (200 μmol m−2 s−1) in Lobaria pulmonaria and Platismatia glauca from different habitats (black circles, xeric open; gray circles, mesic open; white circles, mesic closed) as specified in Table 3. Each symbol represents the mean ± 1SE. See Table 4 for ANOVA results.
