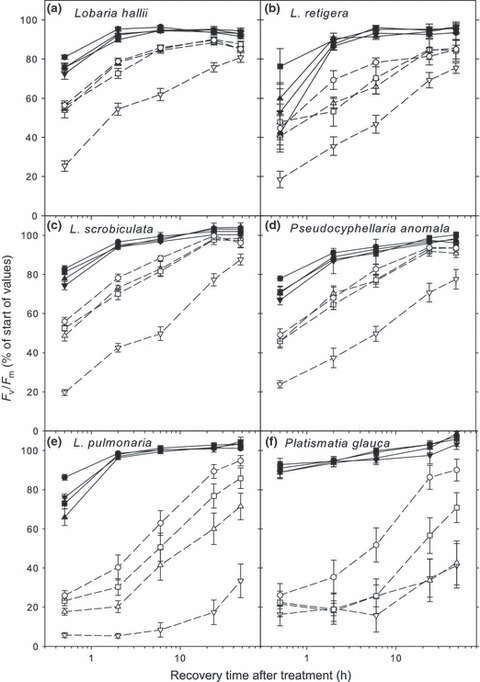
Fig. 3.

Kinetics during recovery (log-scale) for hydrated thalli of the studied species at low light after 7 d of drying treatment in darkness (closed symbols and solid lines) and in medium light (200 μmol m−2 s−1; open symbols and dotted lines). Each symbol represents the mean ± 1SE. Relative humidity during drying: triangles apex down, 0%; triangles apex up, 35%; squares, 55%; circles, 75%.
