
FIGURE 8.
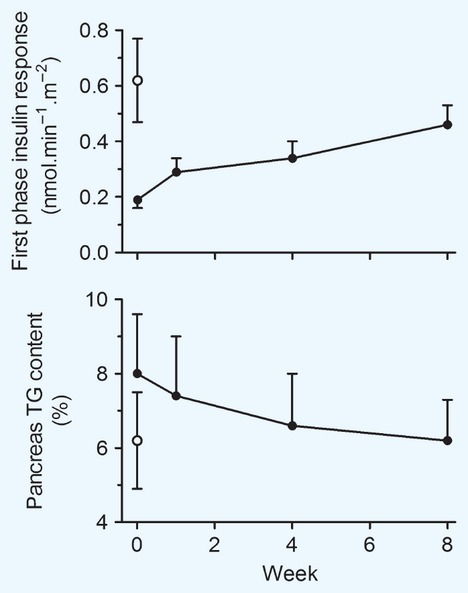
During the 8 weeks of the hypocaloric diet there were steady and reciprocal changes in first-phase insulin secretion (upper panel) and pancreas fat content (lower panel). Values for the weight-matched control group without diabetes are shown as open circles. Reproduced from Lim et al. (2011) 25.