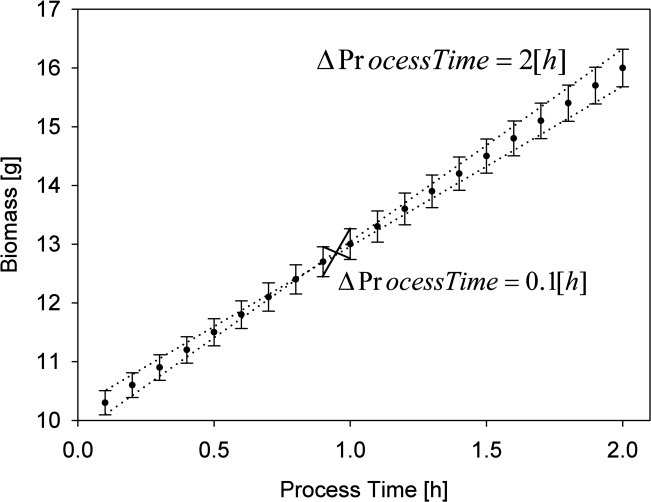
Figure 1.

Graphical representation for the numeric differentiation of biomass growth using a small Δt (solid line, 0.1 h of process time on the x-axis) and a large Δt (dotted line, 2 h of process time on the x-axis); 2% relative standard deviation on biomass measurements (y-axis).
