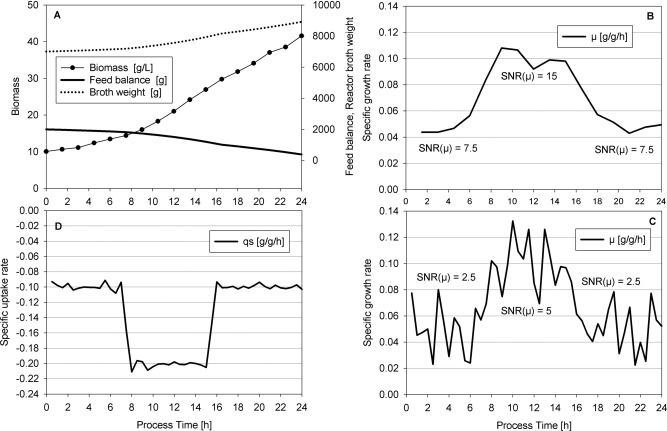
Figure 2. In silico generated data for a typical fed-batch (Microbial culture, Glucose Feed 400 g/l) with an artificial increase from μ = 0.05 h−1 to μ = 0.1 h−1 at process time = 8 h and back to μ = 0.05 h−1 at process time = 16 h.
(A) Progression of raw data required to calculate specific rates: biomass concentration (artificially added noise: 1.5% relative error), feed balance and reactor broth weight; (B) Specific growth rate with a Δt of 3 h according to Eq. 19 with a signal-to-noise ratio of 15 and 7.5 at μ = 0.1 h−1 and μ = 0.05 h−1, respectively; (C) Specific growth rate with a Δt of 1 h according to Eq. 19 with a signal-to-noise ratio of 5 and 2.5 at μ = 0.1 h−1 and μ = 0.05 h−1, respectively; (D) Specific uptake rate with a Δt of 1 h as used in Eq. 19.

