Figure 4.

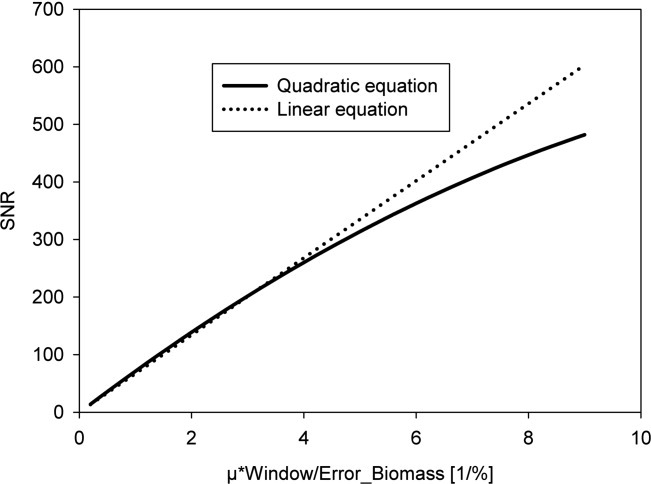
Relation of a combination of biomass error, averaging window (Δt) and specific growth rate to signal-to-noise ratio (SNR); Comparison between linear and quadratic equation.

Relation of a combination of biomass error, averaging window (Δt) and specific growth rate to signal-to-noise ratio (SNR); Comparison between linear and quadratic equation.