Figure 7.

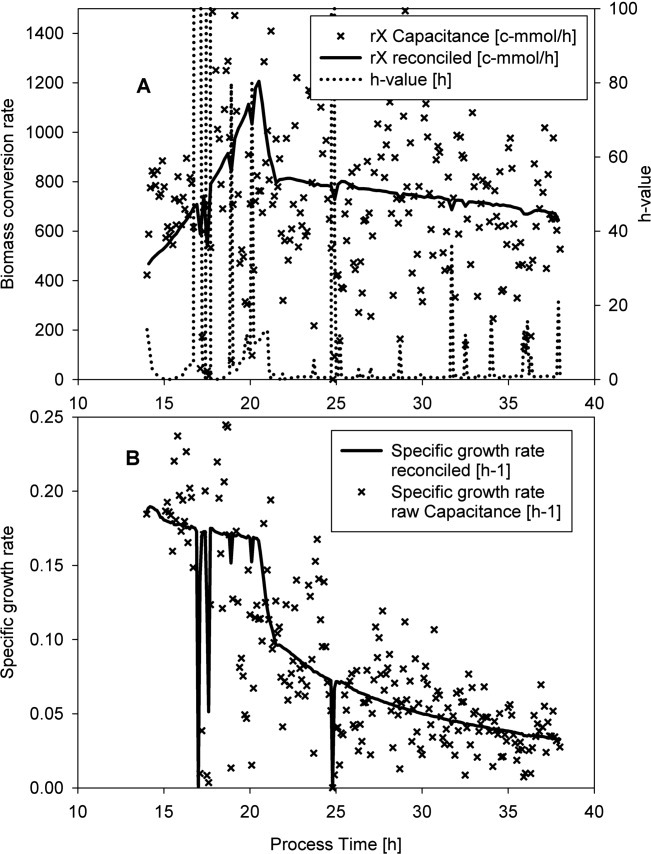
Comparison of the specific growth rates calculated from the raw capacitance signal and after the reconciliation procedure. The data is very scattered due to the high temporal resolution (Δt = 1 h).

Comparison of the specific growth rates calculated from the raw capacitance signal and after the reconciliation procedure. The data is very scattered due to the high temporal resolution (Δt = 1 h).