
Figure 3. Apoptosis rate after 2 h plating for feeder-independent culture.
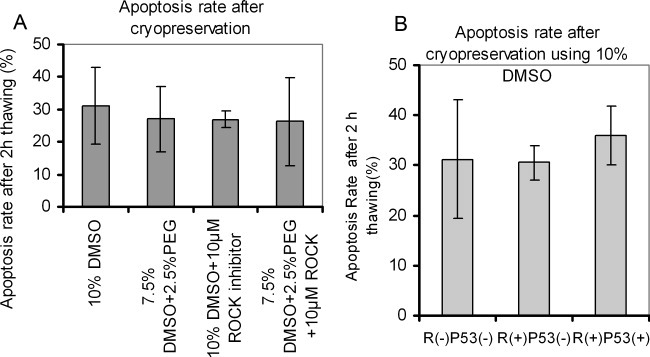
A: Apoptosis rate for the cells frozen at the different conditions, B: Apoptosis rate for the cells frozen by 10% DMSO and then cultured at different conditions after thawing, R(+)/R(−): with or without Rock inhibitor. P53(+)/P53(−): with or without pifthrin μ inhibitior. Results are expressed as the mean of independent experiments ± the standard derivation (n ≥ 3). Statistical analysis was performed using one-way ANOVA.