
Figure 5. Intracellular superoxide anion and the amount of F-actin from feeder-independent culture before and after cryopreservation at different freezing conditions.
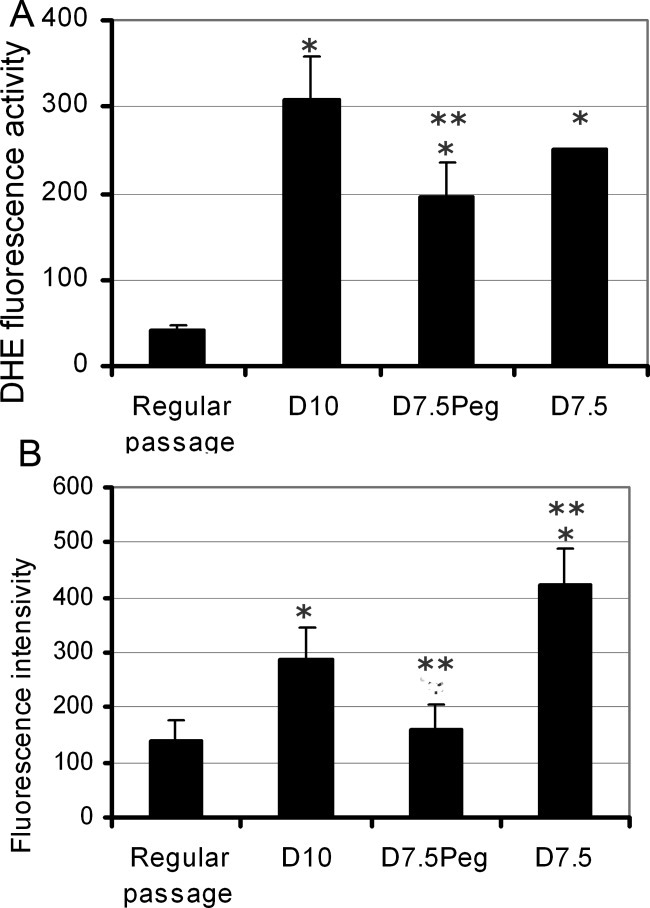
A: Intracellular superoxide anion. B: The amount of F-actin. Results are expressed as the mean of 3–4 independent experiments ± the standard derivation. Statistical analysis was performed using one-way ANOVA, *P < 0.05, compared with the results from regular passage. **P < 0.05 compared with the results from 10% DMSO. D10: 10% DMSO, D7.5Peg: 7.5% DMSO +2.5% PEG, D7.5: 7.5% DMSO.