
Figure 6. Expression of undifferendiated marker, nuclear markers, OCT4 and Nanog, and surface marker, SSEA4, for hES cells at passage two after cryopreservation using 10% DMSO and 7.5% DMSO +2.5% PEG.
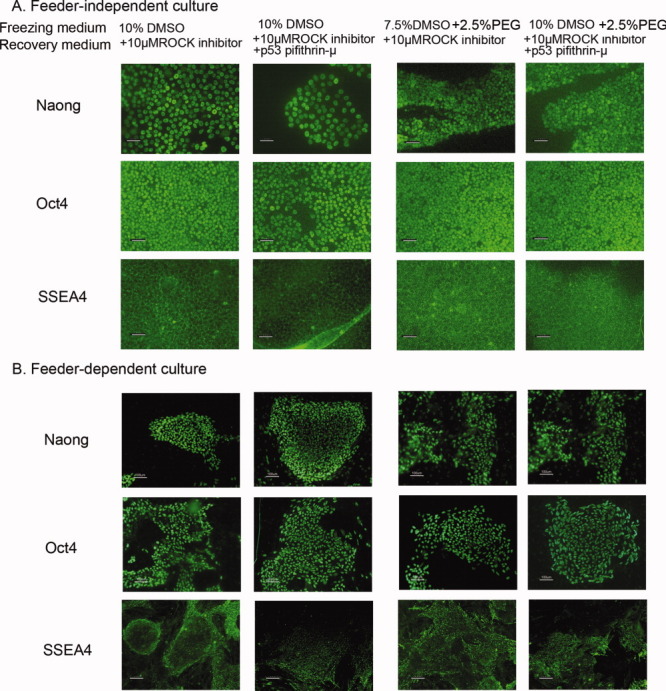
The cells after cryopreservation were cultured in the presence of ROCK inhibitor, or in the presence of ROCK inhibitor and pifithrin-μ. A: Feeder-independent culture, B: Feeder-dependent culture. Scale bar: 50 μm for feeder-dependent culture and 25 μm fro feeder-independent culture, respectively.