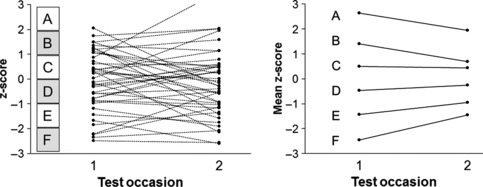
Figure 2.

Simulated data to illustrate regression to the mean. The left hand plot shows individual data points, simulated to have correlation of .5 between time 1 and time 2. The panel showing A, B, etc. shows the ranges of time 1 scores for which mean z-scores are shown in the right-hand plot. The overall mean does not change from time 1 to time 2. However, the means for time 2 increase for those with initial low scores (E and F) and decrease for those with initial high scores (A and B): this is regression to the mean, and is an inevitable consequence of imperfect test–retest reliability
