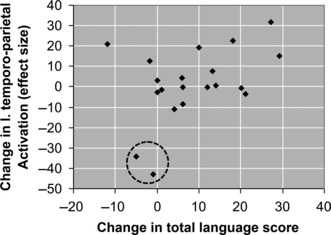
Figure 4.

Scatterplot based on Temple et al. (2003), showing relationship between change in Total Language Score and change in left temporo-parietal activation, from pre- to posttraining in dyslexic children. The dotted circle indicates two outliers who show a decrease in activation over this interval. With these participants included, the Pearson correlation is r = .41, two-tailed p = .06. With the two outliers excluded, r = .24, p = .33
