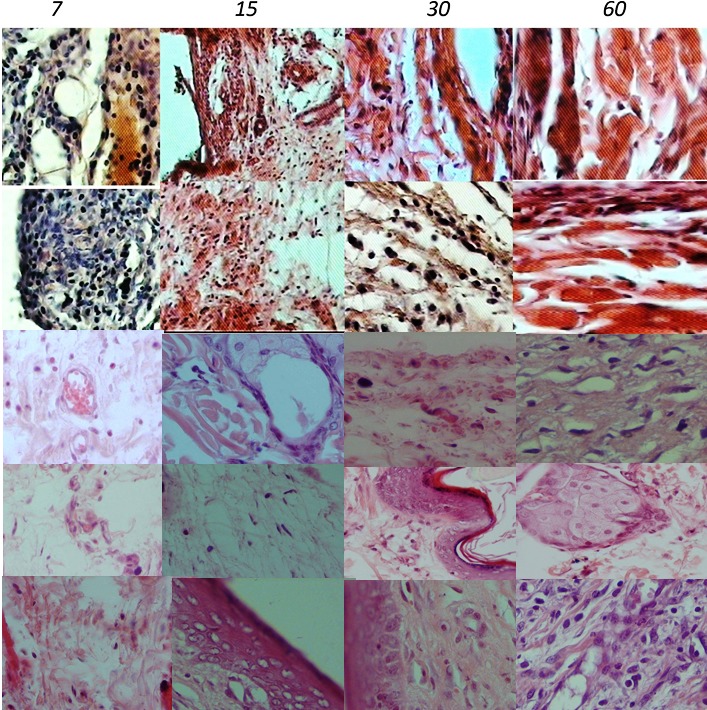
Figure 2.

Histological images of inflammatory cell infiltration at the end of implanted tubes in both groups (First row = ProRoot WMTA; Second row = Angelus WMTA; Third row = Bioaggregate; Fourth row = Geristore® and Fifth row = Control Group) (hematoxylin/eosin staining; original magnification, ×400). Exposure time had inverse effects on the inflammatory response.
