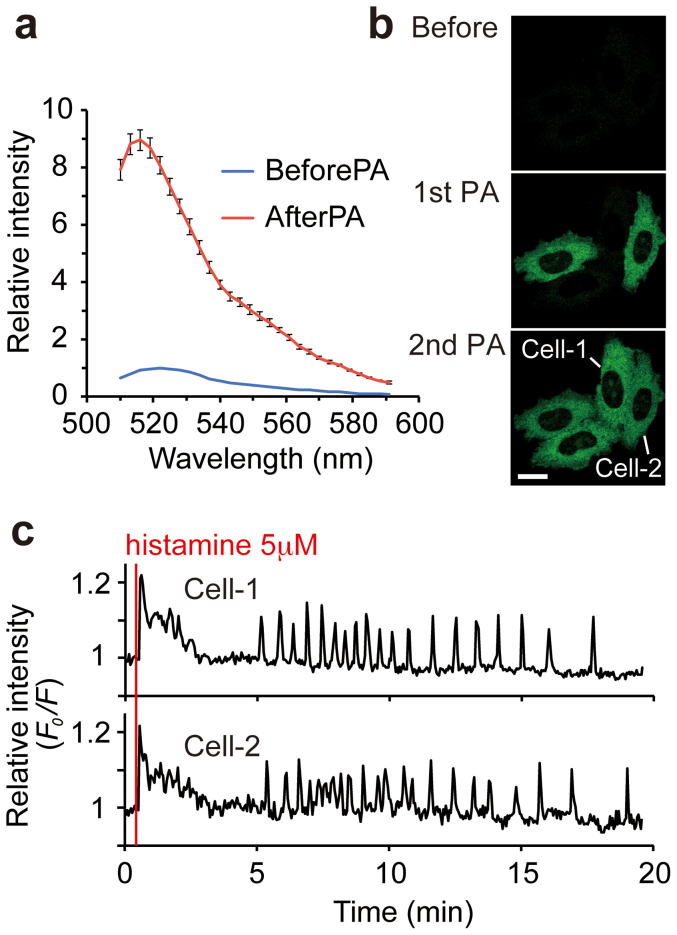
Figure 2. Ca2+ imaging in HeLa cells using PA-TNXL.
(a) Fluorescence spectrum of PA-TNXL in HeLa cells before and after photoactivation (PA). Error bars, s.d. (n = 8). (b) Confocal images showing photoactivation of PA-TNXL in HeLa cells. Two different cells expressing PA-TNXL were photoactivated using 405-nm light stimulation at 1st PA and 2nd PA. Scale bar: 20 μm. (c) Relative fluorescence intensity ratio F0/F of the 2 cells depicted in (b). F0 is the averaged intensity of the initial 10 frames. Responses to stimulation with 5 μM histamine are shown.

