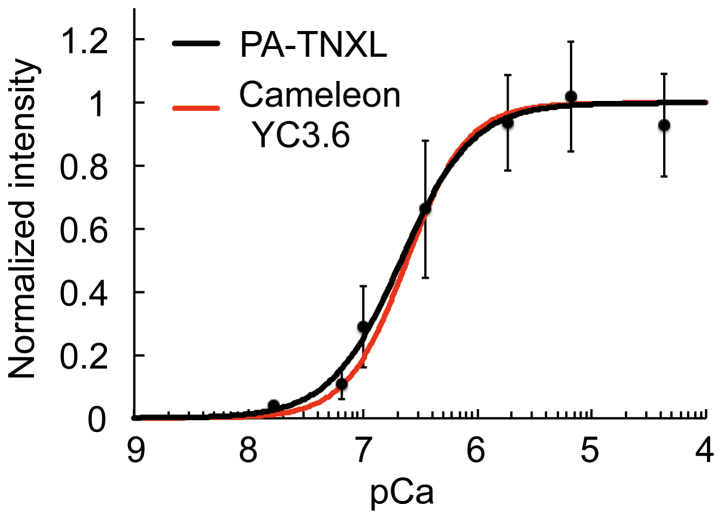
Figure 3. Ca2+ titration curves for the indicators.
The normalized fluorescence intensity change is represented as a function of pCa (−log[Ca2+]). Error bars, s.d. (n = 7). Resulting Kd of PA-TNXL was 215 nM with a Hill constant of 1.4. Titration curve for Cameleon YC3.6 (Kd for Ca2+ was 250 nM with a Hill constant of 1.7) is also shown.

