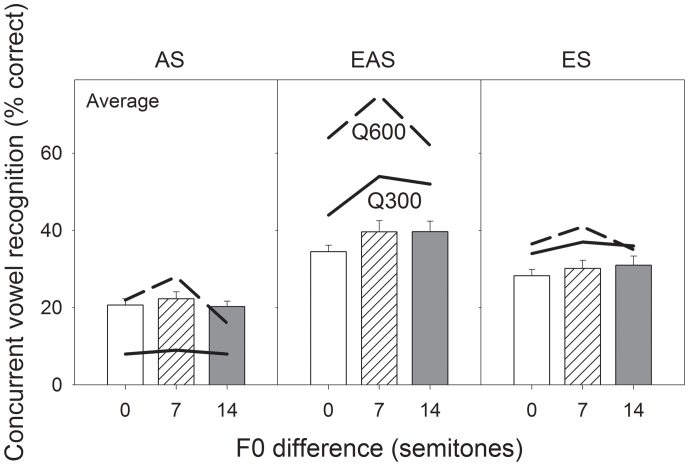
Figure 1. Average concurrent vowel recognition as a function of F0 difference with acoustic stimulation (left panel), electric-acoustic stimulation (middle panel), and electric stimulation (right panel).
The open, hatched, and filled bars represent percent correct scores with a F0 difference of 100–100 Hz, 100–158.7 Hz, and 100–224.5 Hz (or 0, 7, and 14 semitones above 100 Hz), respectively. The chance performance level is 10%. The error bars represent one standard error of mean. Comparable data from Qin and Oxenham's study (2006) are re-plotted as the solid line for the 300-Hz and the dashed line for the 600-Hz low-pass condition.

