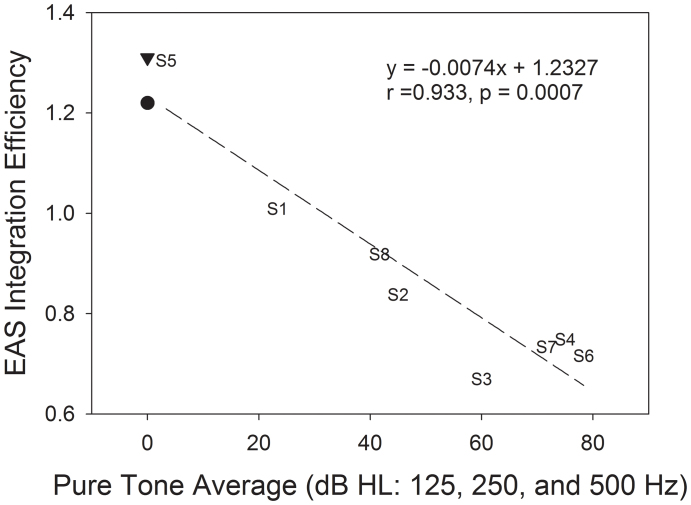
Figure 4. Linear regression between EAS integration efficiency (see Equations 1 and 2 in text for details) and the pure tone average threshold at 125, 250, and 500 Hz (dB HL) in the non-implanted ear.
The EAS integration efficiency from Qin and Oxenham's study (2006) is also shown as a reference but not included in the correlation analysis (filled triangle: Q600; filled circle: Q300). The legend shows the linear regression equation, correlation coefficient (r), and p-value.

