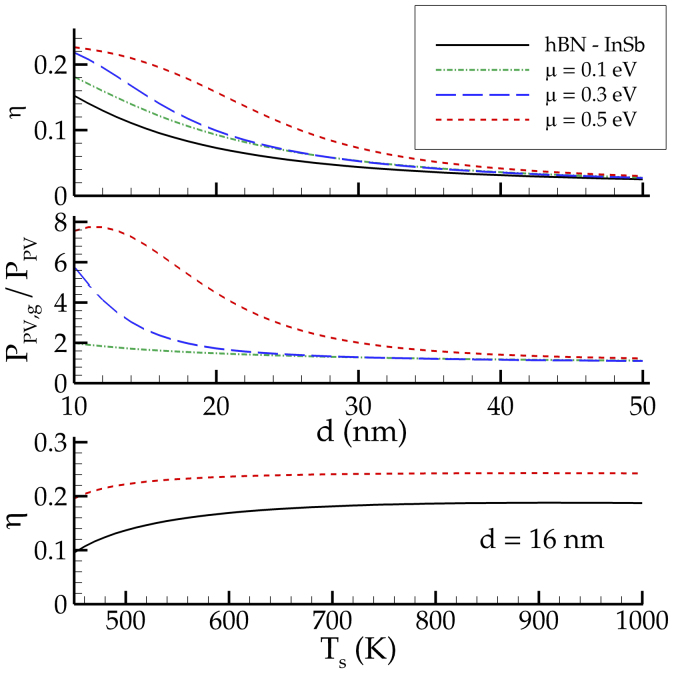
Figure 2. Efficiency and ratio of produced electric power with graphene.
The curves in the first two plots correspond to three different values of chemical potential of graphene. For any distance d here represented, the presence of the graphene sheet produces an enhancement of efficiency as well as an amplification of electric power. The overall effect decreases with respect to the source-cell distance d. The third plot shows the efficiency for the standard NTPV cell and in presence of graphene (for μ = 0.5 eV), for a distance d = 16 nm, as a function of the source temperature Ts.

