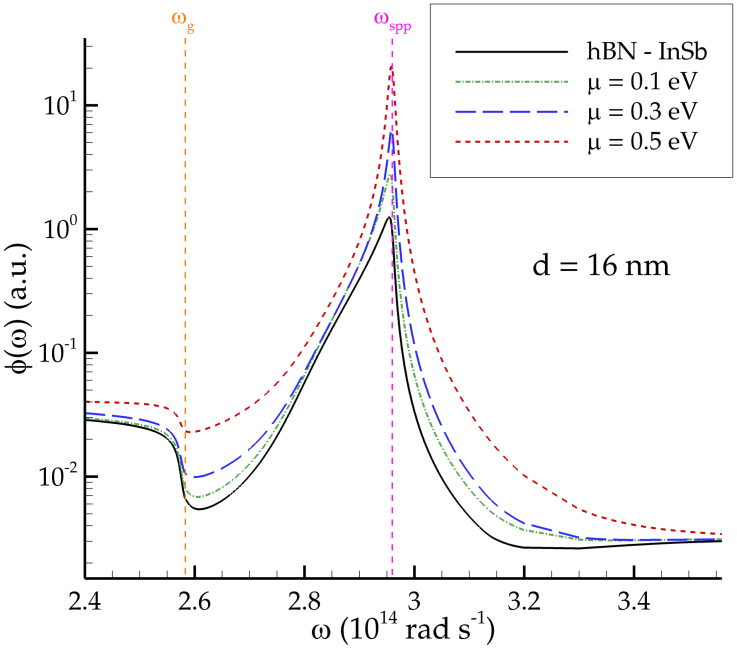
Figure 4. Spectral distribution of radiative flux.
The spectral flux φ(ω) is represented for d = 16 nm in absence of graphene, and with graphene for μ = 0.1, 0.3, 0.5 eV. The curves show an amplification, for any value of the chemical potential, at ω = ωspp. Moreover, for μ = 0.5 eV the width of the peak is significantly enhanced, due to the coupling of surface resonance modes.

