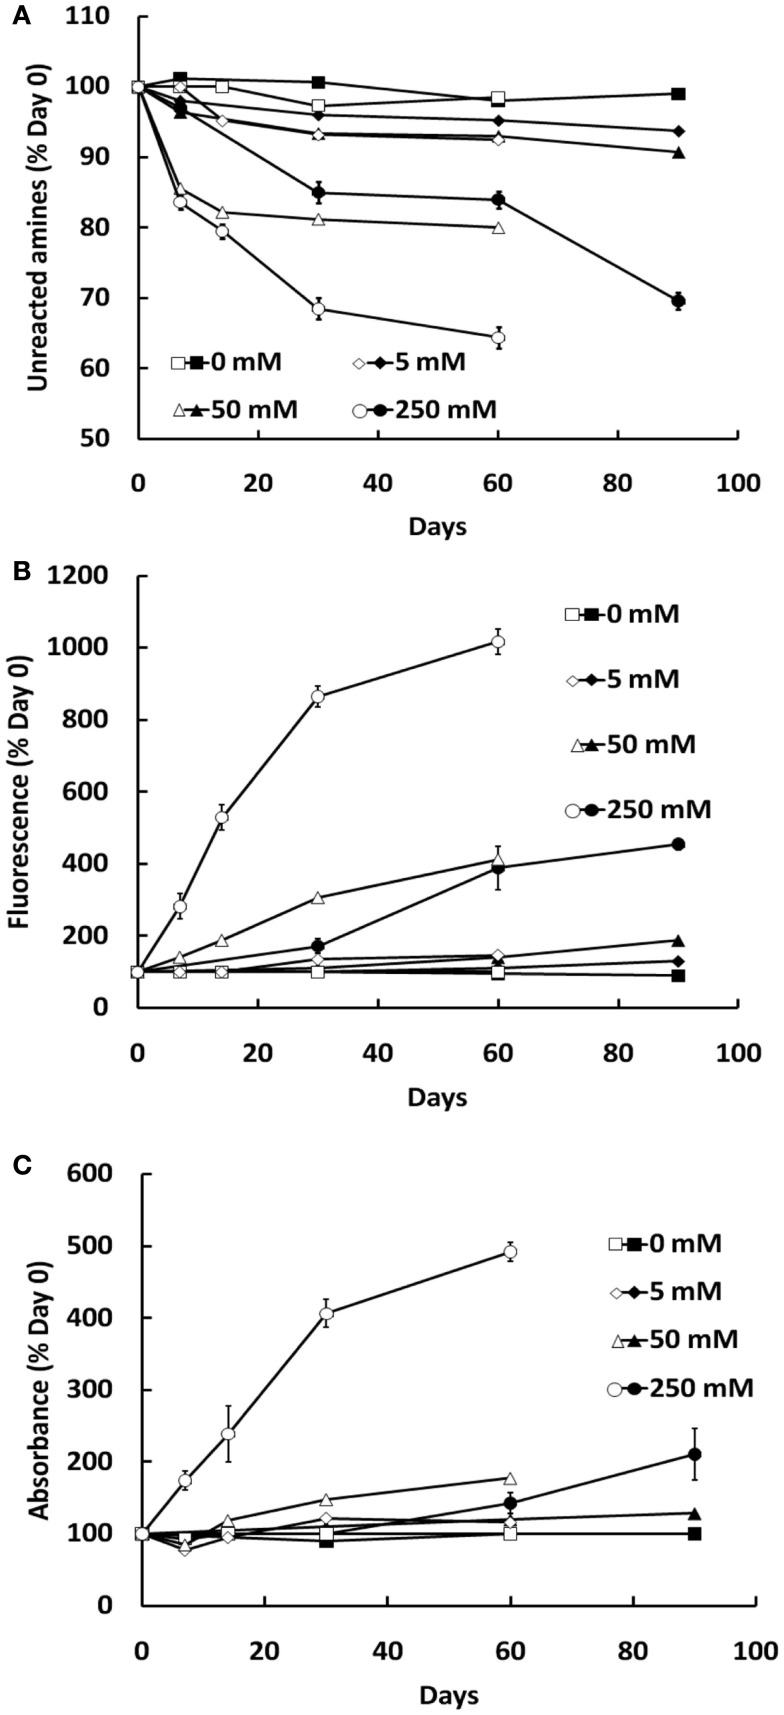
Figure 1.
Glycation of BSA (10 mg/ml) during co-incubation with G6P (open symbols) or glucose (filled symbols), as assessed by the decline in free amine groups (A), sample fluorescence (B), and sample absorbance (C). Symbols represent the mean ± SEM for three separate batches of BSA glycated under identical conditions and each sample was read in triplicate.

