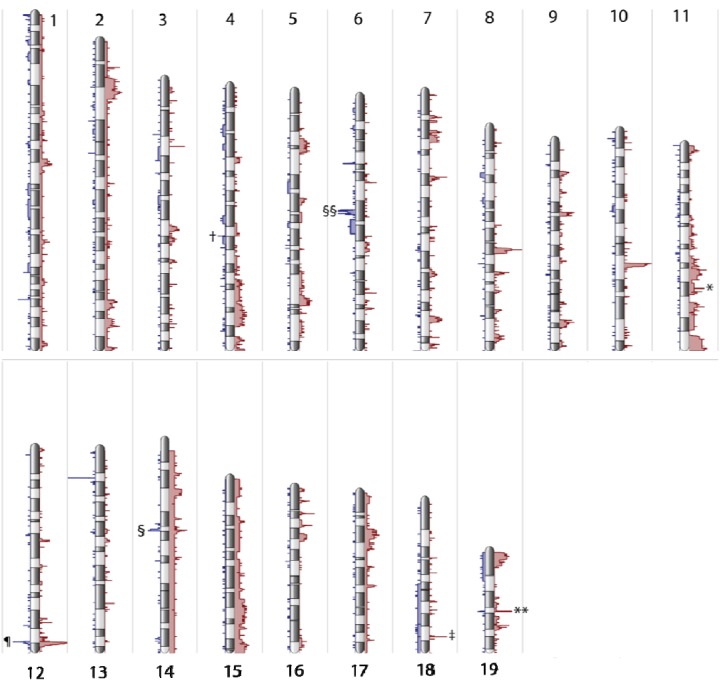
Figure 1.

Global genome view histogram, depicting regions of amplification and deletion. X-axis depicts frequency of amplifications greater than 2.3 copies (red) or deletions less than 1.7 copies (blue). Chromosomes do not show frequent aneuploidy, though trisomy 14 and 15 are present in two tumors. Amplification of genes occurs more frequently than deletions in approximately a 5:1 ratio. Gene regions with common amplification and/or deletion include IgH locus (¶), T-cell receptor alpha (§) and beta (§§), Cdkn2a (†), Sall3 (‡), Tbx2 (*), and Kif11 (**). Chromosomes X and Y reflect the sex of the tumor but demonstrate few CNAs and are depicted in Supplementary Figure 1.
