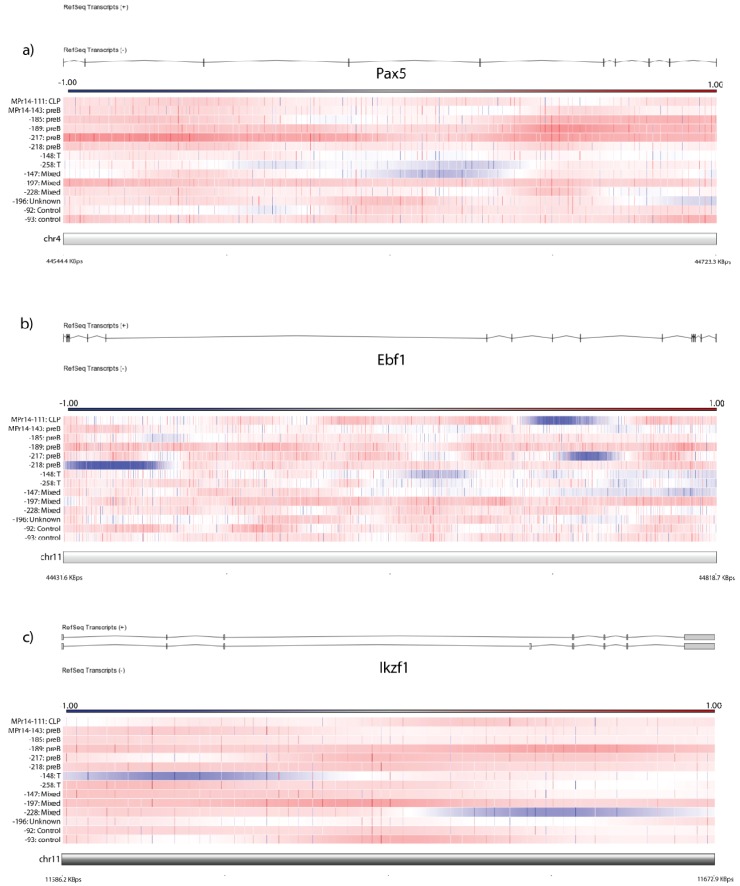
Figure 2.
Copy number alterations in B-cell development genes. Horizontal bars reflect individual tumors; individual oligo amplification (red) and deletion (blue) are depicted by vertical marks, and areas of amplification/deletion are deleted by individual color change on the respective bars. Color code for CGH graphs is depicted above each graph and represents the log ratio of the array. Array depicted against exonic/intronic region of gene. Samples are arranged by BCR/TCR-based tumor type as listed in Table 1. Depiction of CNAs often cover small regions and are sometimes only intronic, as seen in (a) Pax5, (b) Ebf1, and (c)Ikzf1.

