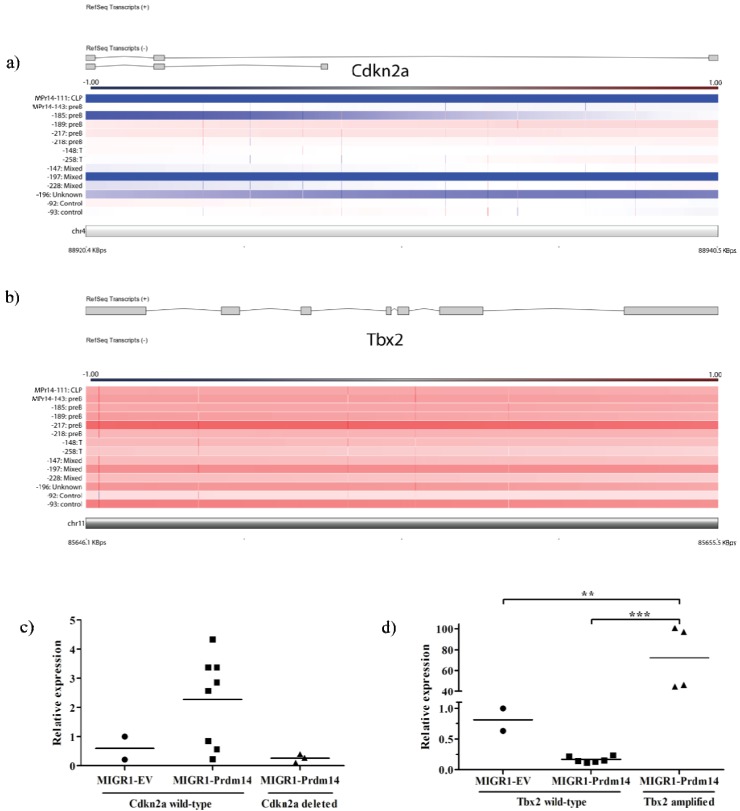
Figure 3.
Depiction of regions of deletion and amplification, depicted with gene exons and gene expression. Color code for CGH graphs is depicted above each graph and represents the log ratio of the array (deletion is blue, amplification is red). Samples in (a) and (b) are arranged by BCR/TCR-based tumor type as listed in Table 1. (a) Four tumors have complete deletion of Cdkn2a, with entire sequence deleted.; (b) Tbx2 is amplified in four tumors; (c) Expression of Cdkn2a is low in all tumors with gene deletion, but low expression is not exclusive to these tumors (p = not significant); (d) Tbx2 expression is markedly elevated in all tumors with gene amplification. Amplification of Tbx2 is reported in control #93 but no concomitant rise in expression is seen. *** indicates p < 0.001, ** indicates p = 0.001–0.01.

