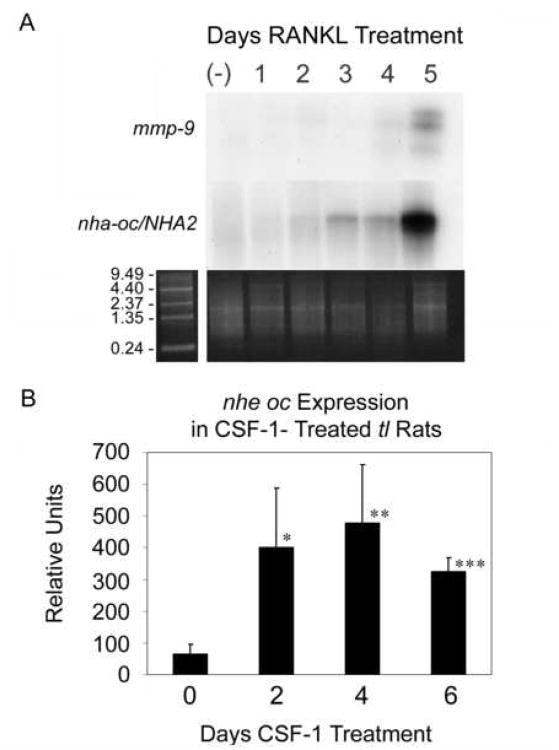
Figure 3. nha-oc/NHA2 mRNA expression.
(A) Northern Blot analysis of differentiating RAW 264.7 cells (top panel) shows similar temporal expression of the nha-oc/NHA2 2 Kb message and mmp-9 in response to RANKL stimulation. The ethidium bromide stained poly A+ gel (bottom panel) is shown as a loading control.
(B) RT-PCR analysis of nha-oc/NHA2 expression in tl rats. Each time was done in quadruplicate ie, tibia + femur from 4 different animals, 1 animal per chip. Statistical analyses were done as t-tests assuming equal variances, validated by first doing F-tests for variance using Excel 15 * p < 0.01, ** p < 0.005, *** p < 0.00001.

