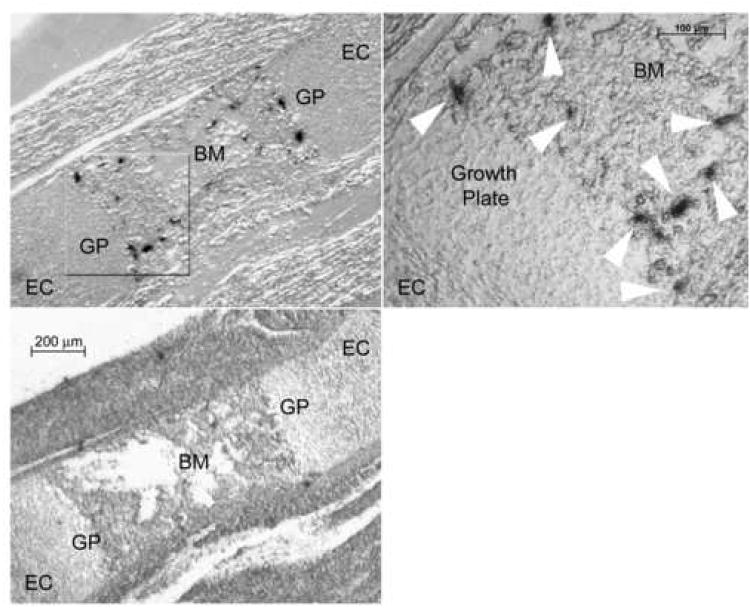
Figure 4.
nha-oc/NHA2 mRNA expression in situ.
Adjacent 17.5 dpc femur sections were hybridized to a 35S-labeled nha-oc/NHA2-specific riboprobe (top, right panel). The highlighted area is shown in a magnified photograph (top, right panel). nha-oc/NHA2 expressing cells (white arrow heads) can be seen on the boundaries of the growth plate, consistent with osteoclast expression. A control (“sense”) 35S-labeled riboprobe was used as a control (bottom, left panel). EC: epiphyseal cartilage, GP: growth plate, BM: bone marrow.

