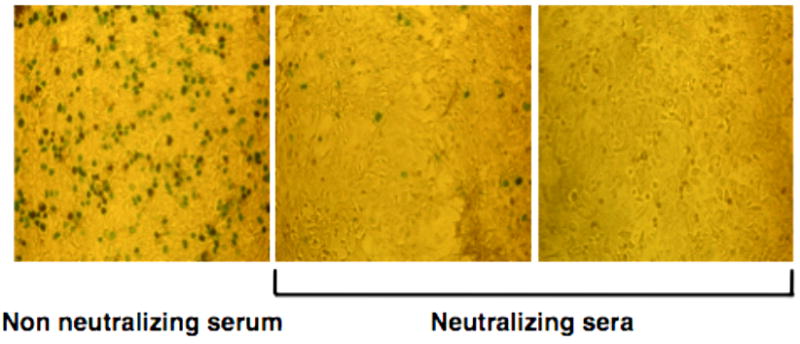
Fig. 3.

Examples of X-Gal coloration detected by microscopy. Left panel: absence of neutralization.Blue spots correspond to transduced cells.Left and middle panels: neutralizing sera with different amounts of neutralizing antibodies. Far right panel, the serum abrogates completely AAV-mediated transduction.
