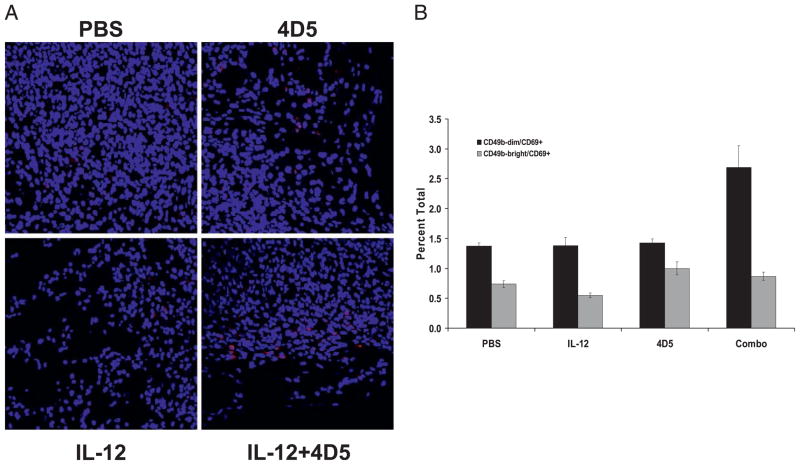
FIGURE 7.
Analysis of NK cell activation status. A, Immunofluorescent microscopy for CD335 (NKp46, an NK cell activation marker, in red) in tumors of treated mice. Tumor sections counterstained with DAPI for nuclear identification. Original magnification ×40. B, Flow cytometry for CD49b and CD69 in the splenocytes of treated mice.

