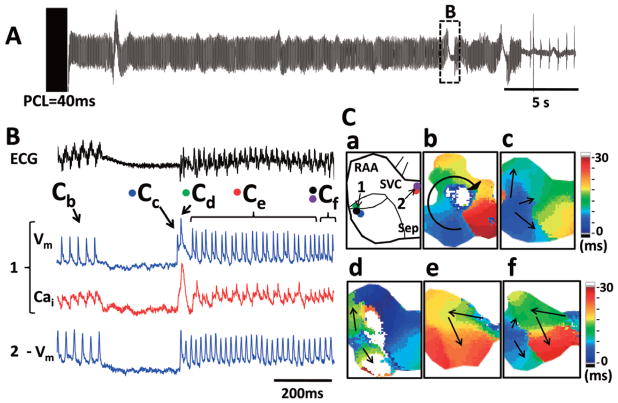
Figure 5.
Spontaneous re-initiation of atrial fibrillation (AF) in transgenic (Tx) atria. (A) Pseudo-ECG showing 2 episodes of spontaneous AF re-initiation. (B) Optical signals of intracellular calcium (Cai: red) and membrane voltage (Vm: blue) at the origin of spontaneous AF re-initiation (site 1) and from the origin of a competing activation wavefront from site 2. Note that after the first 2 beats of AF (Cc and Cd), site 2 activated faster than site 1. Panel C-a is a schematic of the mapped RA. An isochronal map during AT shows a single large reentrant wavefront with clockwise rotation (Panel C-b). After a pause, the first beat (Cc, blue) originated from the junction of the right atrial appendage (RAA) and the right atrium (RA) posterior wall, and the second beat (Cd, green) was triggered from the same site in parallel with elevated diastolic Cai. Beats 3–27 (Ce, red) originated from the same repetitive activation site in the septal area (site 2), with 3:2 conduction into site 1. Afterwards, 2 competing activation wavefronts were present (Cf), resulting in beats 28–31.

