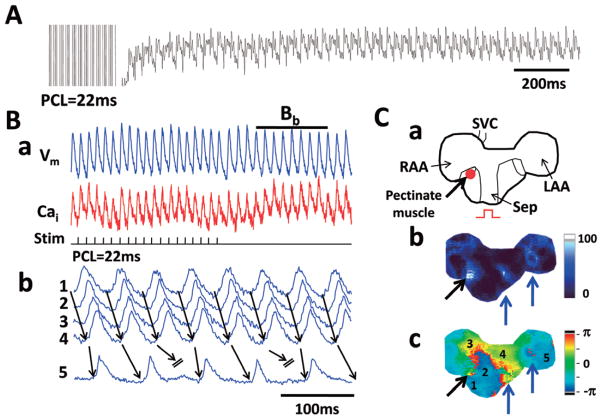
Figure 7.
Reentrant wavefronts and atrial fibrillation (AF) in transgenic (Tx) atria. (A) Pseudo-ECG showing induction of AF by rapid pacing. (B) Vm and Cai tracings recorded during reentrant excitation at sites (1–5) marked in Panel C-c. Panel C-a is a schematic of the mapped region. Panel C-b shows the cumulative phase-singularity distribution. Panel C-c shows a typical phase map during AF. There was phase singularity (black arrow) in the RA (Panel C-c). However, additional phase singularities are also present in the septum and LA (blue arrows). All of them are represented in the cumulative phase map (Panel C-b). Cai, intracellular calcium; LA, left atrium; RA, right atrium; Vm, membrane potential.

