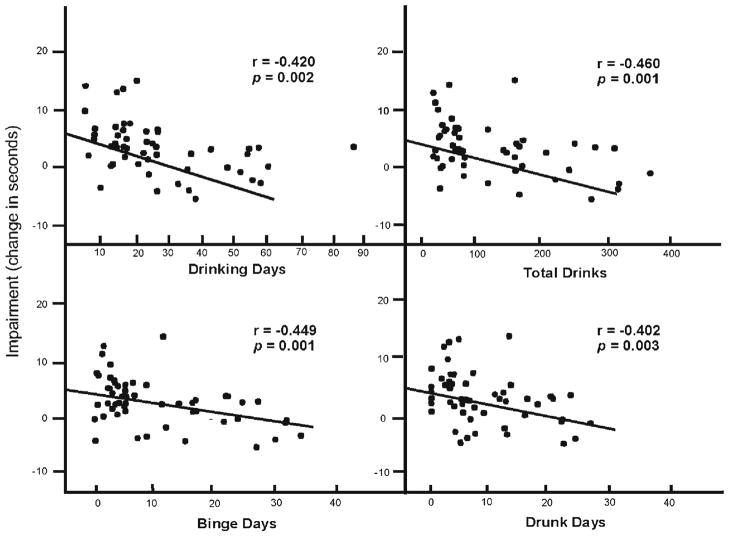
Fig. 1.
Scatter plot of the relationship between drinking habit measures and the change in performance on the grooved pegboard task under placebo to 0.65 g/kg alcohol. Impairment is expressed as an increase in the time (in seconds) to complete the test under alcohol versus placebo. The least-squares regression lines are derived from a simple linear regression of each drinking habit measure and the change in performance score. Pearson r correlation coefficients and p values are presented for each relationship

