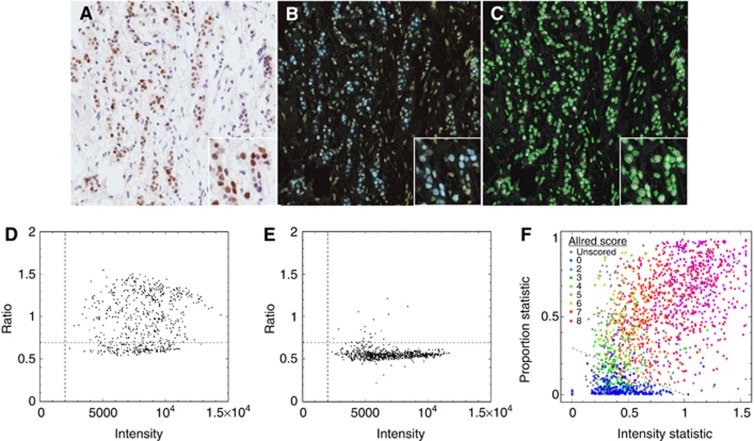
Figure 2.
Astronomical image analysis of nuclear (ER) immunostaining. (A) Example image from nuclear ER staining with Allred manual score of intensity 3 and proportion 5. (B) Converted to an astro-format. (C) Automatic segmentation at the nuclear level with each green ellipse denoting a potential nucleus for further scoring. (D) Ratio of blue channel flux (y-axis) to average reference red green flux (x-axis) for each detected nucleus. The horizontal dashed line is automatically determined from the complete set of objects for all cores in a TMA slide by defining a boundary between unstained and stained nuclei. The vertical dashed line defines a signal-to-noise requirement for nuclei to be considered for scoring. (E) The equivalent summary scatter plot for an example image with Allred manual score of intensity=1 and proportion=2; note the well-defined cluster of unstained nuclei. (F) Scatter plot of the results for manually scored ER images colour coded using the Allred score. The final automatic score is defined using the perpendicular distance of each point from the fixed fiducial dashed line.

