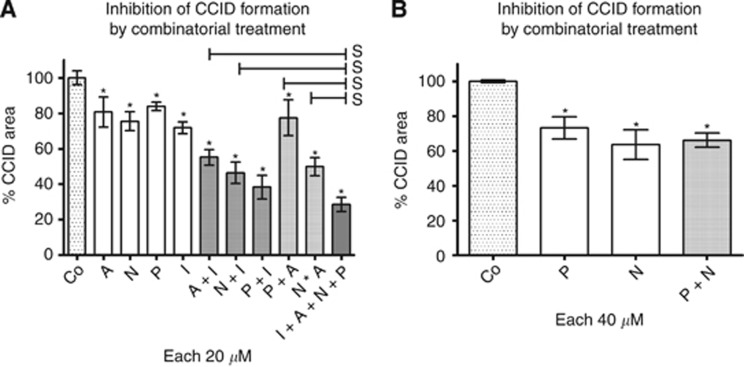
Figure 6.
(A, B) Analysis of drug combinations on CCID formation. MCF-7 spheroids were placed on LEC monolayers and co-cultivated for 4 h either with solvent (DMSO; Co) or (A) with the indicated single drugs (20 μℳ) or drug combinations: acetohexamide (A), nifedipin (N), proadifen (P), isoxsuprine (I) (20 μℳ each; solvent was kept constant). (B) The combination of P together with N (40 μℳ) had no additional effect. Per experimental condition, the areas underneath of at least 12 spheroids were analysed. Error bars indicate mean±s.e.m., asterisks significance (t-test) between control and treatments and ‘s' between double treatments and quadruple treatments (s; P<0.05). The significant differences between single treatments and double (and quadruple) treatments are shown in Table 1.

