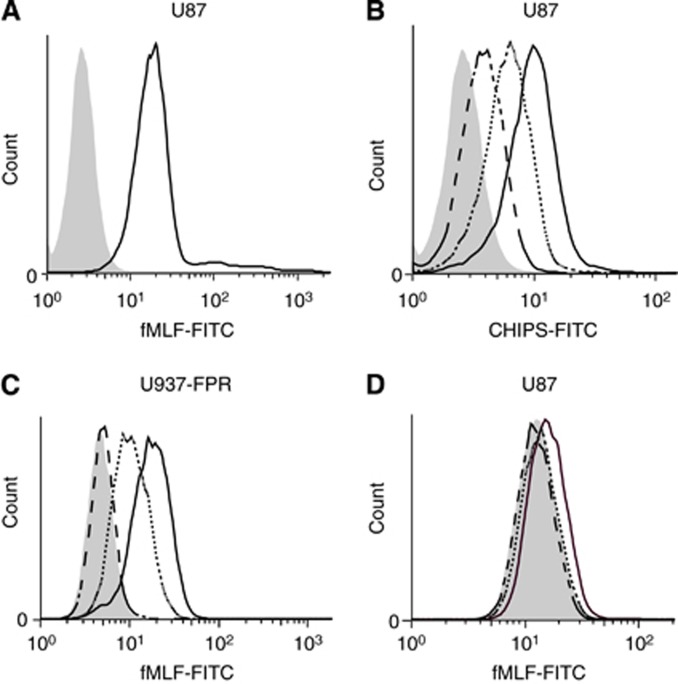
Figure 2.
fMLF and CHIPS binding to FPR1 on U87 astrocytoma cell line. (A) Mean fluorescence intensity of FPR1-expressing U87 cells incubated with fMLF-FITC (continuous black line) and control-stained cells (grey histogram). (B) Mean fluorescence intensity of U87 cells incubated with 3 μg ml−1 CHIPS-FITC (dashed line), 10 μg ml−1 CHIPS-FITC (continuous grey line) and 20 μg ml−1 CHIPS-FITC (continuous black line) and baseline staining (grey histogram). (C and D) Blocking of fMLF-FITC binding to U87 and control cells U937-FPR by preincubating cells with CHIPS. Graphs depict mean fluorescence intensity of U87 (C) and U937-FPR (D) cells when preincubated with 1 μg ml−1 CHIPS (dotted line) or 100 μg ml−1 CHIPS (dashed line).

