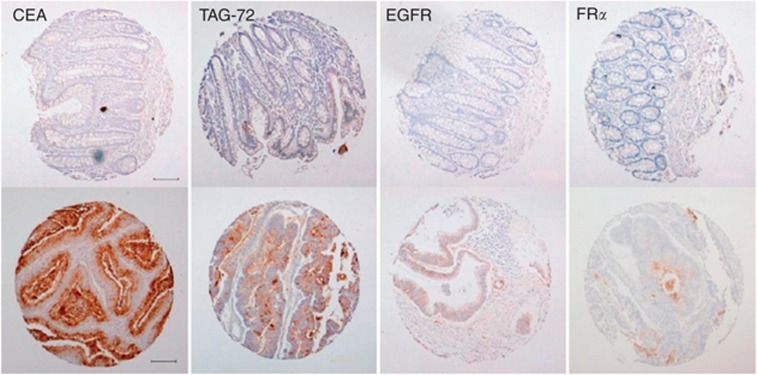
Figure 1.
Representative tissue microarray cores of normal colorectal tissue (top row) and colorectal tumours (bottom row) showing immuno-reactivity as labelled. The normal tissue cores shown demonstrate the median score for that antigen in normal colorectal tissues (CEA=1; TAG-72=2; EGFR=0; FRα=0). The tumour cores shown demonstrate the median positive score for that antigen in colorectal tumours (CEA=15; TAG-72=10; EGFR=2; FRα=1). Scale bar=100 μm.

