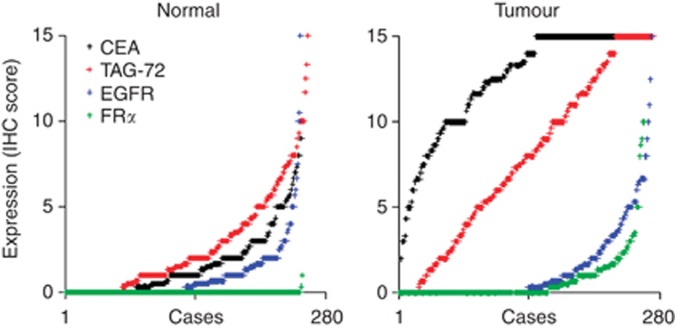
Figure 2.
Expression levels of CEA, TAG-72, EGFR or FRα in normal colorectal tissue (left) and in colorectal tumours (right). Expression levels were determined in 280 matched normal and tumour tissues by immunohistochemistry using semi-quantitative scores of 0–15. The scores for each marker are arranged independently in ascending order to demonstrate the distributions across the cohort.

