Figure 3.
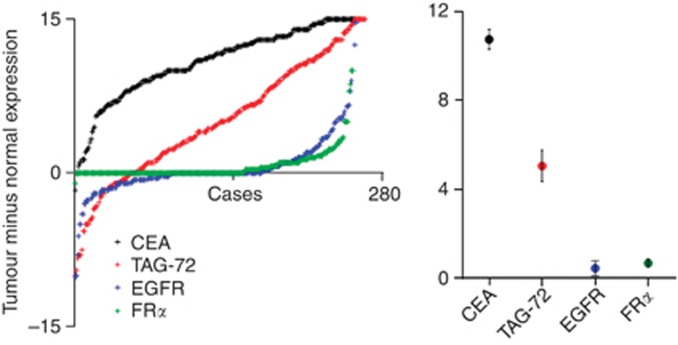
Carcinoembryonic antigen shows the most consistent overexpression in tumour tissues and the greatest differential expression between matched normal and tumour tissues. Left: Expression scores for normal tissues were subtracted from those for matched tumour tissues to quantify the degree of tumour overexpression for each case. Overexpression scores for each marker are arranged in ascending order to demonstrate the distributions across the cohort (left). Minus scores reflect cases where tumour expression was lower than expression in the matched normal tissue. Mean overexpression scores (central marker) with 95% confidence intervals (error bars) are also shown (right).

