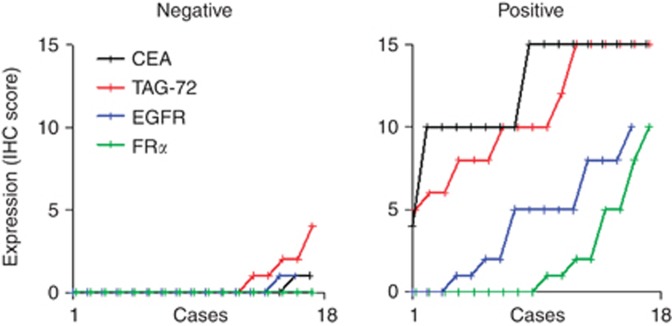
Figure 4.
Expression levels of CEA, TAG-72, EGFR or FRα in lymph nodes, containing colorectal tumour deposits (‘positive' right) and in matched lymph nodes lacking tumour cells (‘negative' left). Expression levels were determined by immunohistochemistry using scores of 0–15 in 18 cases. The scores for each marker are arranged independently in ascending order to demonstrate the distributions across the cohort (note: datapoints are linked by lines to aid interpretation of the distributions not to imply adjacent datapoints are directly related).

