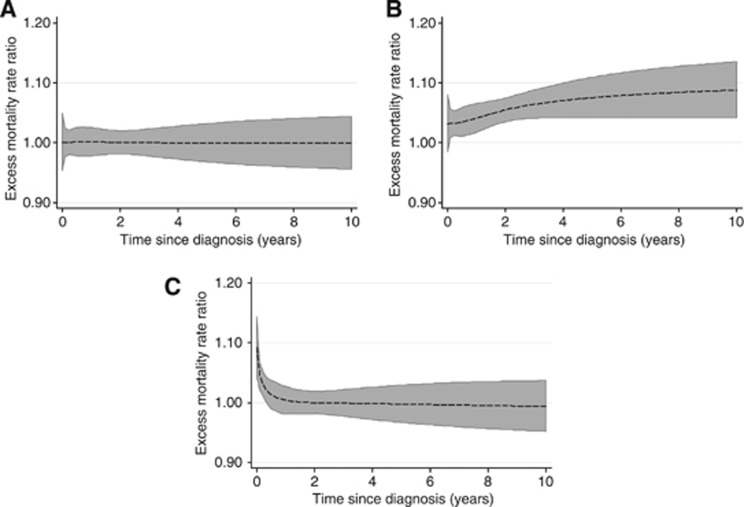
Figure 2.
Combined figure for scenarios. The three subfigures relate to scenarios with 10% missing at diagnosis. The figures show the excess mortality rate ratio with associated 95% confidence interval comparing Population 2 (with the introduced errors) to Population 1. The plotted lines are an average over the 100 simulations. (A) The effect with no traceback from DC and no facility for delayed registration. (B) shows the effect with traceback from DC with no facility for delayed registration. (C) The effect where each patient that is missed initially has a delayed date of registration within a 2-year period.

