
Figure 2.
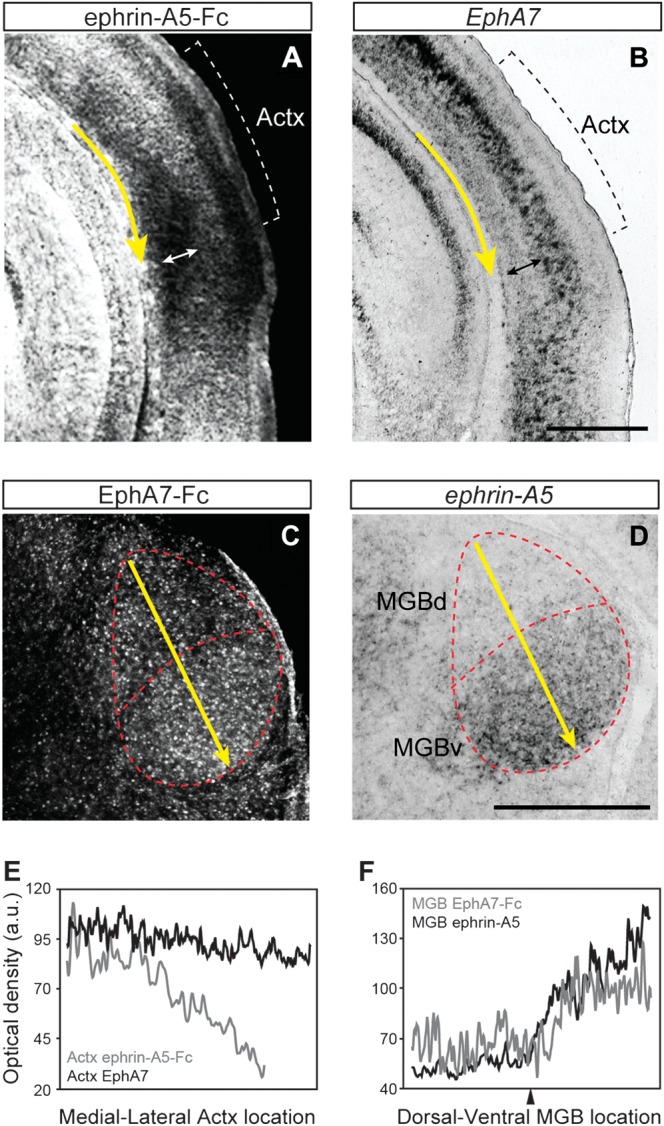
Expression of EphAs and ephrin-As in the postnatal auditory system. Protein expression of EphAs (A) and ephrin-As (C) was detected by the binding of ephrin-A5-Fc and EphA7-Fc chimeric proteins, respectively, at P4. Messenger RNA (mRNA) expression of EphA7 (B) and ephrin-A5 (D) was detected by in situ hybridization at P4. Expression of EphAs (A) and EphA7 (B) in deep layers (indicated by double-headed arrows) of the Actx is present but weaker than the surrounding cortical areas. Expression of ephrin-As (C) and ephrin-A5 (D) exhibits a dorsomedial-low to ventrolateral-high gradient in the MGB. (E and F) Gradients of grayscale values within the deep cortical layers along the medial–lateral axis in Actx (E) and dorsomedial–ventrolateral axis in MGB (F), as indicated by the yellow arrows in A–D. Note that grayscale values are inverted for mRNA expression levels (black lines in E and F). Arrowhead in F indicates a local minimums at the MGBd/MGBv border. Scale bars: 500 μm.