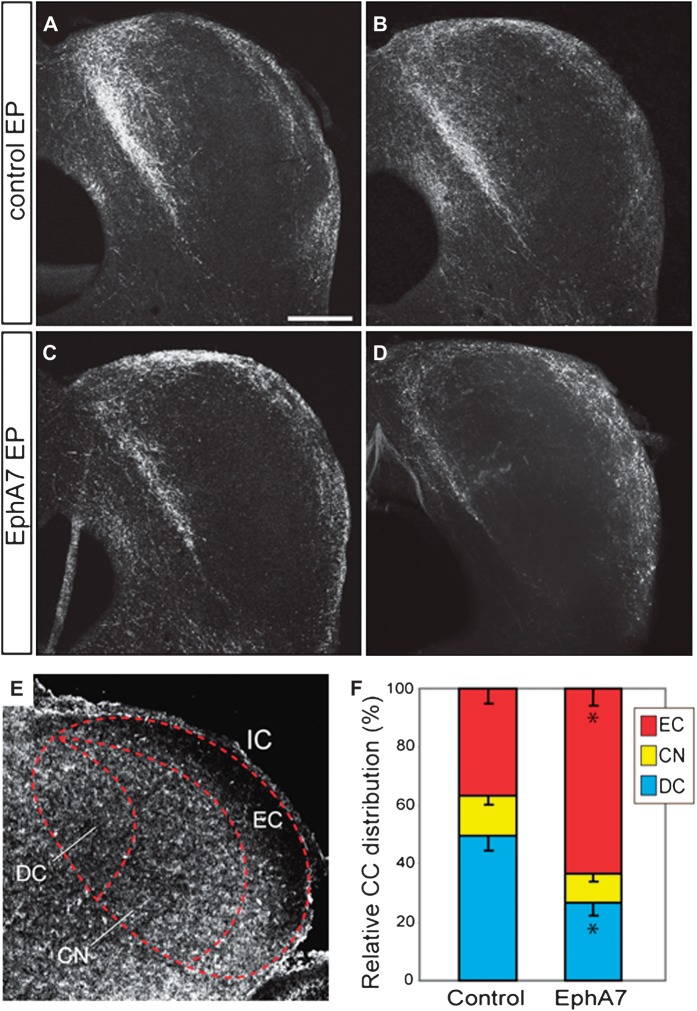
Figure 7.
Overexpression of EphA7 alters targeting of CC projections. (A–D) EGFP immunohistochemistry at P40 on the IC of the brains that received control (A and B) and EphA7 (C and D) electroporation in the Actx at E12.5. A–D correspond to 4 different brains. Scale bar: 500 μm. (E) Gradients of ephrin-As in the IC are revealed by staining for EphA7-Fc chimeric protein binding at P4. (F) Quantification of the relative distribution of EGFP+ axons in the dorsal cortex (blue), external cortex (red), and central nucleus (yellow). Bars represent mean ± standard error of the mean. Asterisks indicate P < 0.01 with an unpaired t-test comparing EphA7 with control.

