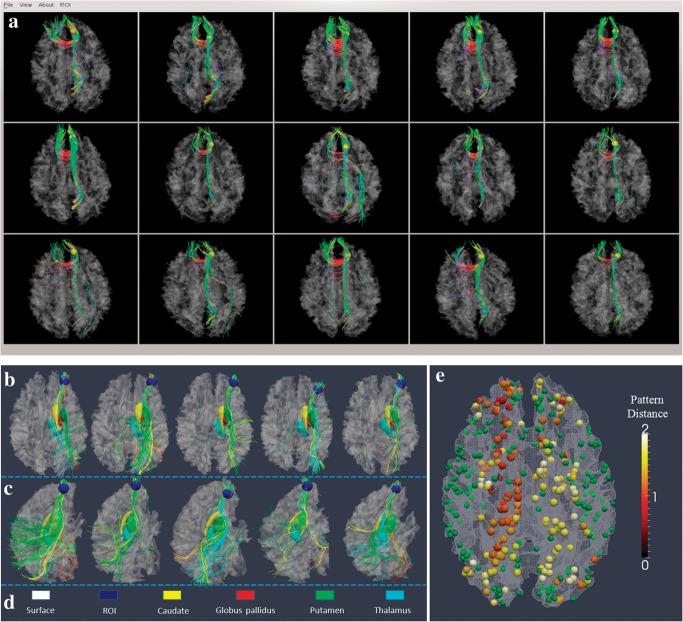
Figure 6.
(a) An example of a predicted DICCCOL landmark (DICCCOL #311) in 5 separate subject brains. The first 2 rows (n = 10) are models, and last row (n = 5) is the predicted result in 5 brains. (b–e) Demonstration that fiber shape pattern represents structural connectivity pattern using subcortical regions as benchmark landmarks. (b) One DICCCOL landmark (blue sphere) and its fiber connections in 5 different brains. The 4 subcortical regions are represented by yellow, red, green, and cyan colors in d. The fibers connected to these subcortical regions are in the same colors. It is evident that this DICCCOL landmark has the same pattern of structural connectivity to these subcortical regions. (c) Another lateral view of the fiber connection patterns. (d) Color codes for cortical surface, landmark ROI, and subcortical regions. (e) The average distances of structural connectivity patterns for 175 DICCCOL landmarks that have strong fiber connections (over 50 fibers) to subcortical regions. Other DICCCOL landmarks are shown in green.

